Air Traffic Control
1Q 2024
The equity markets continued their rally during the first quarter despite lowered expectations for interest rate cuts, stubbornly high inflation, and seemingly lofty valuations. The bond market, on the other hand, did take those headwinds into consideration as rising yields pushed down prices, particularly after the March inflation report came in above expectations at 3.5%. That made three months in a row of above-expected inflation, a fact that is sure to make the Federal Reserve (Fed) question a potential rate cut in June.
As we mentioned in our last commentary, just a handful of stocks drove most of 2023’s returns, and the same has been true this year. Ten stocks accounted for 62% of the total market return in the first quarter[1]. A key driver of this outperformance has been the powerful earnings growth of these large companies. In 2023, the Magnificent Seven (Mag 7)[2] had earnings growth of 34%, while the other 493 companies in the S&P 500 had negative earnings growth of -4.4%. This earnings leadership is expected to dissipate over the next two years, and the other companies are expected to see earnings grow. In 2025, the Mag 7’s projected earnings growth is 16.6%, while for the rest of the S&P 500, it is 12.5%, and for small cap companies, as represented by the Russell 2000 Index, it is 28.2%[3]. This gives us encouragement that there is still positive equity performance ahead despite what looks like high valuations.
Looking at valuations, the forward price-to-earnings (P/E) stood at 20.5 times for the S&P 500 versus a 30-year average of 16.7[4] (as of this writing). However, this higher-than-average valuation may be warranted when looking deeper into the S&P 500 Index. The index has changed over time to include fewer lower-P/E cyclical companies (financials, industrials, materials, and energy) as a percentage of the index, but higher-P/E growth and stable companies (technology, communication services, health care, staples, discretionary, utilities, and REITs). As recently as 2007, cyclicals made up over 45% of the index, but today make up only 28.3%[5]. Also supporting higher valuations is earnings growth, which as mentioned above, is expected to accelerate. Finally, over $6 trillion sits on the sidelines in money market funds, which will likely be reallocated once interest rates begin to fall.
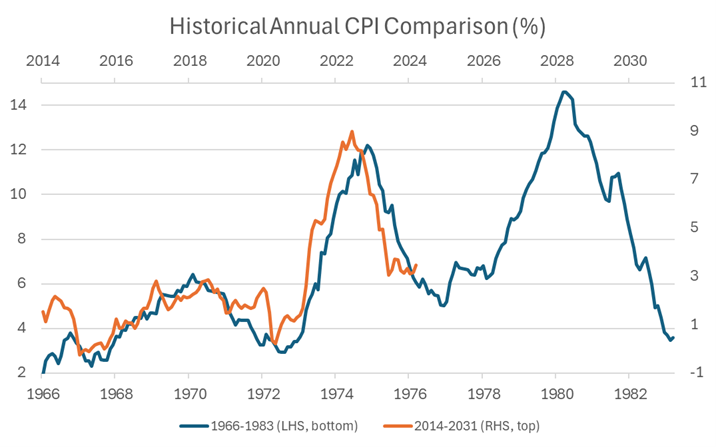
That brings us to the multi-trillion-dollar question: when will rates fall? The markets started off the year expecting five or six interest rate cuts, and now some pundits wonder whether we will even get two. The Fed is carefully trying to navigate a soft landing, but they need clear signs that inflation is heading toward their target of 2% before lowering rates. This may be difficult to achieve with a still strong U.S. economy and labor market. The Fed wants to avoid making a mistake like it did in the late 1970s when they cut rates too soon, and inflation accelerated even higher. The chart below shows an eerily similar path back then to where we are today[6].

Other central banks may be in a better position to cut rates sooner than the Fed given some economic drawdown in the United Kingdom and Europe. This may lead to some short-term weakness in the U.S. dollar, but the dollar is still the dominant reserve currency for the world and should remain so for the foreseeable future. The U.S. economy has remained resilient and productivity growth has been increasing. There is hope that the Fed can engineer a soft landing. Hopefully air traffic control can wave them in safely.
If anything, the last couple of years have proven the importance of staying diversified, staying invested, and staying confident. There is sure to be turbulence in a world where there is no shortage of geopolitical issues, but we are here to help walk you through it.
[1] Source: Morningstar. Data as of March 31, 2024. Past performance is not a guarantee of future results. Investors cannot invest directly in an Index.
[2] Alphabet (Google), Amazon, Apple, Meta (Facebook), Microsoft, Nvidia, and Tesla
[3] Source: ClearBridge Investments, FactSet, Russell, S&P. Data as of March 31, 2024.
[4] Source: J.P. Morgan Asset Management. Data as of April 10, 2024.
[5] Source: ClearBridge Investments, Piper Sandler, FactSet, S&P. Data as of March 31, 2024.
[6] Source: Brand AMG, St. Louis Federal Reserve, Bureau of Labor Statistics. Data as of March 31, 2024.
