Corrections Happen When They Happen – Never Sooner
1Q 2017

Ever since the election of 2016, pundits have been calling for the next big pullback in the US stock market. At first, it was supposed to happen because Trump was elected. When that didn’t happen, it was supposed to occur in early 2017. Then it was supposed to be once the Fed hiked interest rates. Then it was the failure of an Obamacare replacement. The point is, most “experts” out there have their eyes peeled for the next pullback. But the fact is, most corrections happen when the market is complacent and least expects it – not when everyone is looking for it.
The last correction began back in 2015 after a 2.5 year period during which the S&P moved higher by about 50% with only a few minor pullbacks. The catalysts for the 2015 correction were issues that nobody saw coming: a Greek bond default and public referendum where the country rejected any additional austerity, followed a few weeks later by significant volatility in the Chinese stock market (which in turn created volatility in all other emerging markets). But the markets recovered, and eventually moved higher. A current read on underlying economic data shows us that the US economy is still doing quite well – a trend that was in place even prior to the election. The only thing market-related that changed on election night was an increase in the odds that the US economy might receive a benefit from lower taxes, less regulation and more fiscal stimulus.
During the first quarter of 2017, US large cap stocks continued their run, with the S&P 500 ending +6.1% on a total return (including dividends) basis. Mid cap stocks ended +5.7%, while small caps finished +2.5%. For the first time in several quarters, international stocks were stronger than US stocks across all categories. European markets were strong contributors to the international out performance, while a falling US dollar was also helpful. In all, developed market stocks were +7.4%, with international small stocks performing even better (+8.1%) than larger ones. Emerging market stocks, however, stole the show – ending the quarter +11.5%.
In the world of bonds, other than high yield bonds and emerging market debt there wasn’t much to write home about in the first quarter. Following a large spike in interest rates in the fourth quarter of last year (when the 10-year Treasury yield surged from 1.56% to 2.60%), rates hovered around the 2.45% level for most of the first quarter. This resulted in the “core” bond index (the Bloomberg Barclays US Aggregate Bond Index) returning 0.8% for the quarter.
While the pundits stay on watch for the next pullback, we will continue to maintain our core investing principles: staying diversified and rebalancing where appropriate. They are important values, as trying to time the market can hurt an investor’s return. A study by Dimensional Fund Advisors on the performance of the S&P 500 from October 1989 through December 2016 found that for investors who stayed invested in that index, their annualized return over that timeframe was 9.4%. But for those who tried to time the market and missed the single best day (which usually happens at the bottom of the market and includes a strong snap-back) over that 27+ year time frame, the return dropped to 8.9%. For those who missed the five best days, the return dropped to 7.8%. Missing the best 25 days dropped the return to 4.0%.
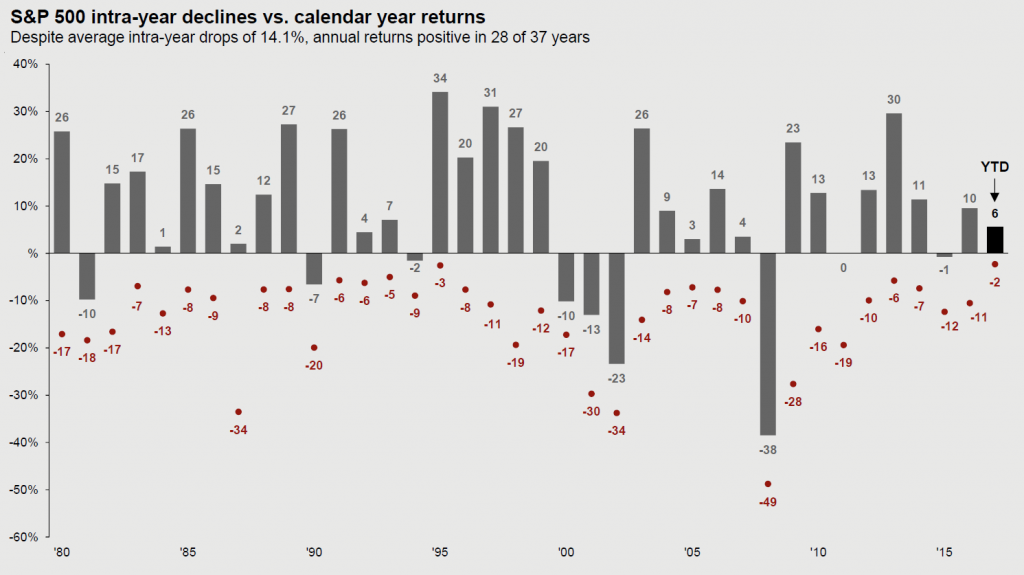
It’s important to remember that stocks are a risky asset class, but one that offers the potential for higher long-term returns. Pullbacks occur often – as the chart below shows, the average intra-year drop is 14.1% (the median drop is 11%). Paramount to realizing the higher long-term return potential in stocks is not missing the best days. Investors who sold stocks following the election have realized that over the past five months.
Source: FactSet, Standard & Poor’s, J.P. Morgan Asset Management. Returns are based on price index only and do not include dividends. Intra-year drops refers to the largest market drops from a peak to a trough during the year. For illustrative purposes only. Returns shown are calendar year returns from 1980 to 2016, over which time period the average annual return was 8.5%. The 2017 bar represents the year-to-date return and is not included in the average annual return calculation. Guide to the Markets – U.S. Data are as of March 31, 2017.

