Debt, Growth, and The Deficit
By Tim Egart, CEPA®, CFP®
A few weeks ago, Moody’s downgraded the U.S. credit rating from the top level of Aaa to Aa1. In their report, they cited two primary reasons – growing debt levels and sustained higher interest expenses. While Moody’s was late to the party (S&P downgraded our debt in August 2011 and Fitch did it in August 2023), U.S. stock market futures initially dipped. Within days of that event, the “Big, Beautiful Bill” passed the House of Representatives. While it still must pass the Senate, the Tax Foundation estimates the bill will add ~$3.3 to $5.3 trillion to the deficit through 2034[1]. If our fiscal outlook is apparently poor, what are the macro-economic factors we should be paying attention to? Data outlining the present situation can be illustrative.
To start, let’s ensure we have a baseline of important points to work from.
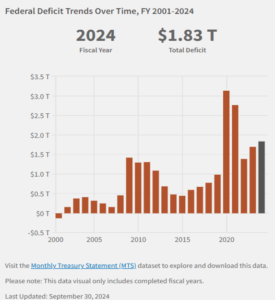
The US Deficit for Fiscal Year 2024 was $1.83 trillion. We brought in Revenue of $4.92 trillion and spent $6.75 trillion. That deficit is projected to be $1.9 trillion in 2025 [2]. Importantly, the credit downgrades have less to do about the U.S. meeting their obligations today and more about the trajectory of our debt growth.
From 2001-2007, we borrowed ~2.4% of Gross Domestic Product (GDP) on an annualized basis.[3] For 2025, our annual fiscal deficit is estimated to be 6.2% of GDP – the highest in any U.S. non-war, non-recessionary experience. By 2055, the Congressional Budget Office projects that spending to be 7.3%.[4]
Our Federal Government spends money on both Discretionary Items (i.e. Defense, Transportation, etc…) and Mandatory Items (i.e. Social Security, Medicare, etc…). Mandatory Items represent 2/3 of the Federal outlays per year at roughly ~$4.6 trillion.
In the face of long-term budgetary challenges, we can do one of two things: cut spending or raise revenue (either via tax increases, tariffs, or growing the economy). In our present environment, it’s difficult to envision meaningful spending cuts being implemented, since a large portion of our expenses are mandated by Congress. Likewise, raising revenue via tax increases (or the expiration of the Tax Cuts & Jobs Act) appears to be non-starter given the present state of Congress. With that in mind, the path that the current administration has chosen is to solve our long-term debt issues by increasing the growth trajectory of our economy.
What does that mean, why does it matter, and is it even possible?
In the 1970s, 80s, and 90s, the United States averaged Real (i.e. net of inflation) GDP growth of over 3% per year. In the 2000’s, we dropped to 1.9% and ~2.4% annualized since 2010.[5] You can see the trendline for our growth since the early 2000’s in the chart below.
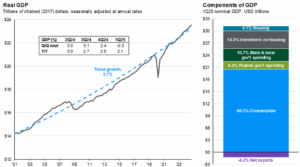
To navigate this balancing act, the Administration (whether you agree with them or not) is focusing trade, tax, and deregulation policy on the three primary figures below.
- 3% Annual Budget Deficits – This is going to be tough to accomplish in 4 years. Pre 2020, our annual budget deficit trended closer to 4-5%. Thus, the most significant way to accomplish this is by fixing the denominator in the equation; growth….
- 3% Real GDP Growth – Coinciding with a cut to Government spending, growth should theoretically fall. If it’s replaced by more productive private enterprise growth, that could lead to a more effective outcome longer term. Thus, the stated purpose of the “Big, Beautiful Bill” in Congress now. While The Tax Foundation estimated our deficit would rise by 3.3 trillion to $5.3 trillion by passing this bill, it also estimated that our annual Real GDP would rise by .6%/year with the Bill’s passage. (i.e. moving trend growth from 2.1% to 2.7%)
- Increasing $3M barrels of oil production/day – At present, the US produces $13M barrels of oil/day. In aggregate, the world produced ~96M barrels of oil/day in 2023. Treasury Secretary Scott Bessent seeks to improve our impact on global production by ~25%.
Growth solves a lot of problems.
Below is a chart that highlights how sizeable it’s impact can be in 2034 under Secretary Bessent’s “Ideal Scenario.” Ultimately, our debt/GDP could fall from a projected ~133% today to 100% – much more manageable over the long haul. Absent real & hard cuts to spending, we must grow the economy at a faster rate.

There wasn’t just one issue that got us into this situation and there’s not one single solution that will get us out of it. Whether it’s the seeming chaos of our tariff policies or any political negotiations on capitol hill, our world is uncertain. But it always has been and always will be. In 2020, COVID created great uncertainty. In 2022, the Russian invasion of Ukraine and the Federal Fund Rate increases again brought a lot of uncertainty. Today, it’s U.S. debt and trade policy. Tomorrow, we can’t know what it will be, only that it will be something. It’s important for investors to control what we can and leave aside what we cannot.
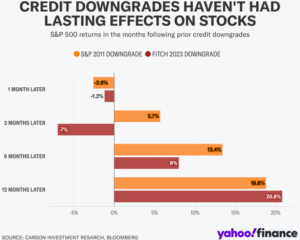
If history serves as a guide, stocks recovered quite well following the 2011 and 2023 downgrade of U.S debt. While the S&P 500 has already recovered better than the 1 month data below, we’ll see if the other data rings true.[7]
Regardless, our focus is on investing for the long haul – staying disciplined to a structure that’s designed to succeed through volatility. And it’s an honor to navigate that with the families we serve.
[1] https://taxfoundation.org/research/all/federal/big-beautiful-bill-house-gop-tax-plan/
[2] www.fiscaldata.treasury.gov
[5] https://www.crestmontresearch.com/docs/Economy-GDP-R-By-Decade.pdf
[6] JP Morgan Guide to the Markets
[7] Investors cannot invest directly in an index.