“Ten Years Hence: O Lehman Brothers, Where Art Thou?”
3Q 2018
September 15, 2018 marked the ten-year anniversary since the failure of Lehman Brothers – a major milestone in history marking the beginning of the largest financial crisis since the Great Depression. At the time, many investors feared a total systemic collapse. Stocks were sold indiscriminately with the S&P 500 falling 46% over the next six months, while many investors succumbed to behavioral finance pitfalls, abandoning their principles of diversification and flocking to “safe-haven” assets like US Treasury bonds. Scared to come out of their shell for the next several years, many of those investors missed out on the largest gains of the recovery.
Fast forward to today, and we find ourselves in the tenth year of economic expansion, which is the second-longest expansion since the Civil War. (And if the US economy doesn’t fall into recession before July of next year, it will officially become the longest expansion.) Likewise, the US stock market is in its tenth year of a bull market and is again putting together an impressive set of returns. Year-to-date, large US company stocks are +10.6% on a total return basis (including dividends), with mid-sized and small-sized US companies +7.5% and +11.5%, respectively. (Though we recognize October is off to a rough start as we write this…)
On the other hand, international stocks have lagged US stocks and have been under pressure for most of 2018, causing many investors to question the value of owning them. Large developed market international stocks (represented by the MSCI EAFE Index) are -1.0% for the year, while smaller developed market stocks are -1.9% and emerging market stocks are -7.4%. Part of the problem currently weighing on international stocks relates to the US position on tariffs, but another contributor has been the US Federal Reserve steadily raising interest rates. When the Fed raises interest rates, it draws money into the US and pushes up the value of the US dollar. This can create a headwind for international stocks.
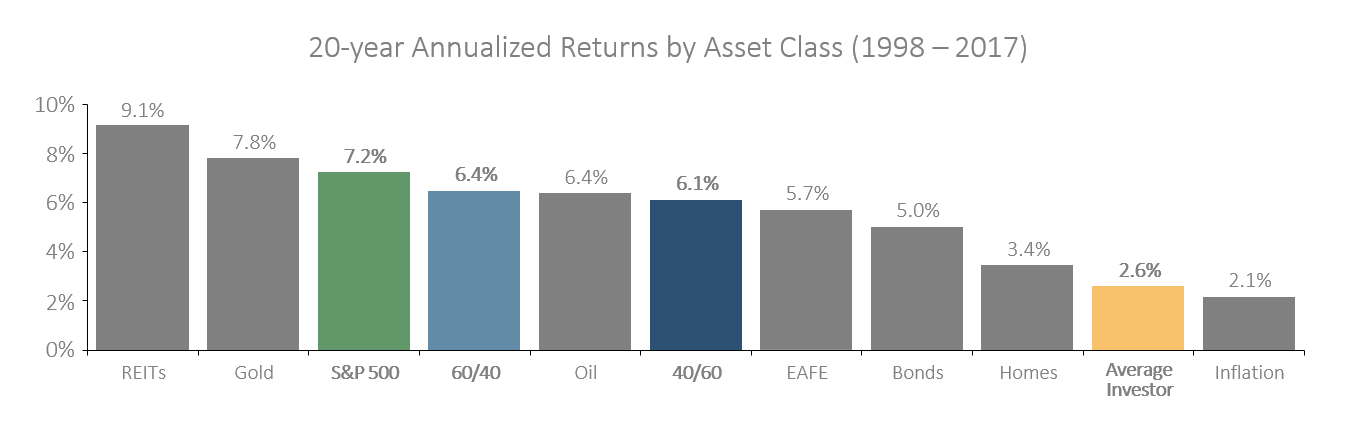
It is important, however, to remember that international stocks naturally experience phases of underperformance, just as they experience phases of outperformance (and sometimes for long periods and quite substantially, like the six-year period from 1983-1988 and the six-year period from 2002-2007). While most economies are in much better shape than they were ten years ago, not all countries progress and grow at the same rate. It is often tempting for investors to want to get rid of what hasn’t worked lately and buy more of what has been working. But that is a key behavioral finance pitfall that largely explains why the “average investor” underperforms nearly every asset class available over the long run (see chart below).
In times like this, investors should remember that you shouldn’t try to time the market – things can change when you least expect it. A year ago, markets feared a NAFTA-like trade deal was out of reach. Six months ago, the world was scared that the US would go to war with North Korea. But one break in diplomacy – one trade agreement, one denuclearization agreement – can leave the past behind and chart a new course for a country’s economy. There are bound to be points in your investing journey when it might seem like certain things aren’t working, but it is important to stay balanced and stick to your plan. Over the long run, maintaining sound investment principles like diversification, and avoiding behavioral finance pitfalls pays off.
Chart Source: J.P. Morgan Asset Management, Morningstar, and Dalbar Inc. as of 12/31/17. Indexes used above are as follows: REITs = NAREIT Equity REIT Index; EAFE = MSCI EAFE; Oil = WTI Index; Bonds = Bloomberg Barclays US Aggregate; Homes = median sale price of existing single-family homes; Gold = USD/troy oz; Inflation = CPI; 60/40 = a balanced portfolio with 60% invested in S&P 500 and 40% invested in Bloomberg Barclays US Aggregate. Average investor return based on analysis by Dalbar, which uses net of aggregate mutual fund sales, redemptions and exchanges each month as a measure of investor behavior. Returns are annualized (and total return, where applicable). Past performance is not indicative of future returns.