The Case of the Missing Volatility
4Q 2017

In spite of all the political bickering (and not just here in the US), 2017 was a great market for stock investors. What was really remarkable was the forward motion with such little volatility. Among the major stock indices, most charts for the year looked like a 45-degree angle higher, without so much as even a single 5% pullback. US stocks (as measured by the S&P 500) ended the year up 21.8% on a total return (including dividends) basis. We saw the 2nd highest number of all-time highs in a year since 1956 (at 62 – tied with 1964, but still well behind the 77 all-time highs posted in 1995). However, the final return number was only the 17th best, which was not even in the top quartile of best performances.
But even better than US stocks were international stocks, with developed markets up 25.0% (as represented by the MSCI EAFE index), and emerging markets up 37.3% (using the MSCI Emerging Markets index). Much of the positive performance of international stocks was due to improving fundamentals, but a falling US dollar (and therefore rising foreign currencies) helped add fuel to the fire. Seems like the only thing that did better than stocks was Bitcoin (but that’s a topic for a later date).
Naturally, following a great year like 2017, investors want to know what to expect next. As always, it depends on the economy and corporate earnings (and any wildcards along the way). The economy continues to do well, and companies continue to grow earnings, hire people, and invest in new buildings, technologies, and projects. All things equal, we hope the cycle will feed itself. Additionally the global economy is performing better with low unemployment and inflation, while fundamentals are showing marked improvement in both Europe and Asia. The impending US stimulus from lower corporate tax rates are already showing up in the form of employee bonuses and likely higher dividend payouts and share buybacks may help propel the stock market higher. In short, we don’t expect a reversal of current trends, but know that we live in a cyclical world.
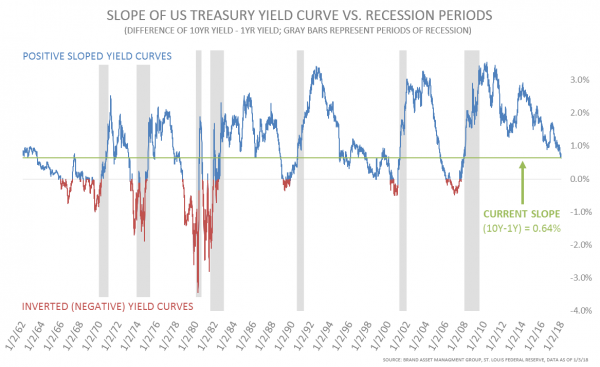
Looking beyond stocks, core bonds had a modestly positive year (short-term bonds +1.3% and core intermediate bonds + 3.5%). Although the Fed hiked short-term interest rates three times during the year, and began shrinking its balance sheet in October, ten-year yields (as represented by the ten-year Treasury bond) ended the year about where they started at 2.4%. That was another topic of rising interest in 2017 (pun intended): the flattening yield curve. As many pundits pointed out, this phenomenon can be a precursor to recessions. Acknowledging that the yield curve right now is relatively flat, we would note that it has been this flat (and flatter) several times in the past (see chart below), and that this can persist for many years before a recession. We would also note that due to the more open, globalized nature of capital markets today, there may be more factors at work in today’s yield curve than in the past. With many foreign countries’ yield curves already at very low rates (some even negative), there is naturally more demand for a 10-year US Treasury bond that yields 2.4% than there is for a German 10-year Bund at 0.4% or a Japanese 10-year government bond at 0.05%. Because of that, US yields at the “longer” end of the curve could remain relatively anchored for a long period, which would naturally result in a flattening yield curve.
We don’t know what 2018 will bring, and we hope for another strong year like 2017, but we agree with consensus that record-low volatility may not last for too much longer (though we’ve been wrong about that, too). What we do know is that it’s always a good time to have a diversified portfolio. When we finally have a correction, often what has gone up most unreasonably will fall most quickly. Staying disciplined and rebalancing periodically where appropriate has historically served investors well and should continue to do so for years to come.

